Log Detail Viewer
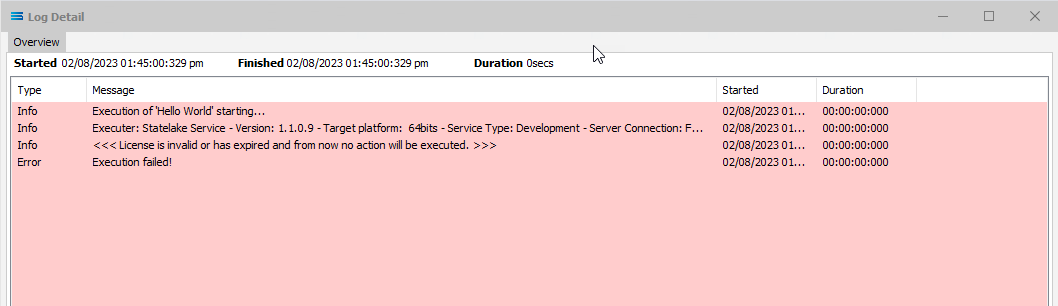
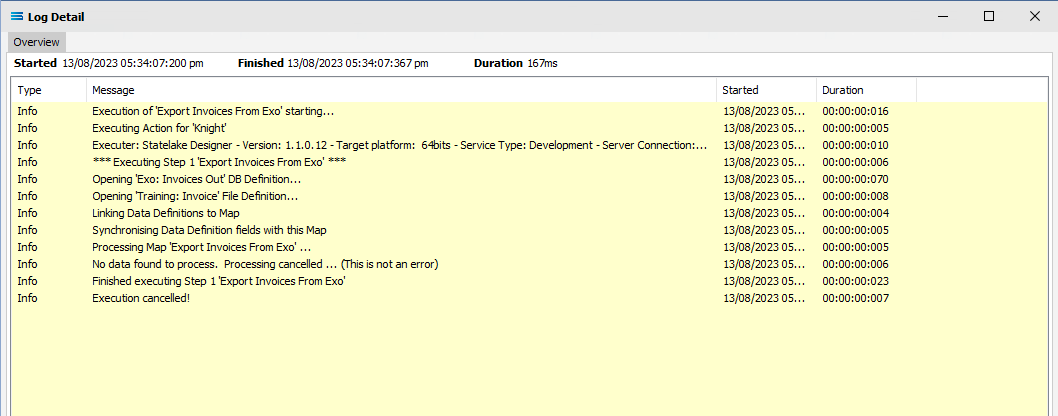
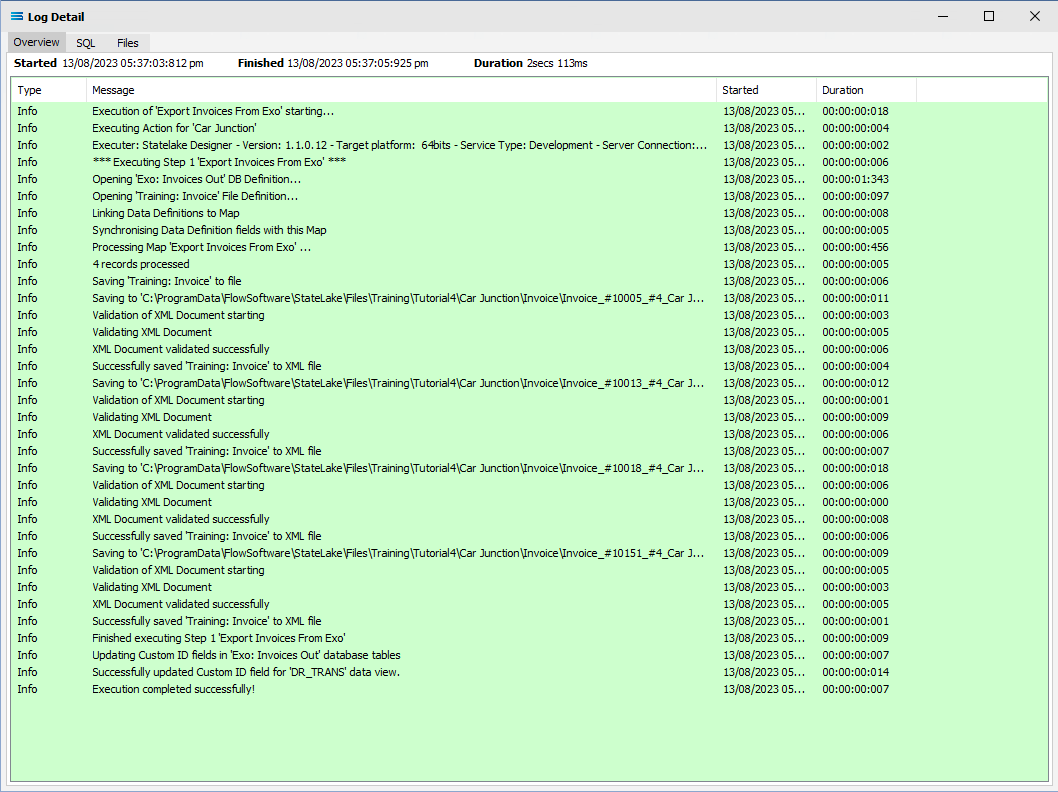
When a Log line is selected on the Manage Logs screen, the Log Detail window will open and display the line-by-line detail of that particular Log entry on a suitably coloured background - successfully completed Logs will be on GREEN, cancelled Logs will be on YELLOW, and failed Logs will be on PINK.
This is the same screen as displayed on the immediate conclusion of the running of an Action.
Tabs
Tab Name | Description |
|---|---|
Overview | Displays a list of message lines created during the execution of the Action. |
SQL | Displays any SQL statements executed during the execution of the Action. |
Files | Displays a list of files read or written during the execution of the Action. |
Overview Tab
Any Log, regardless of its failed, cancelled or successful status, will show the same range of information.
Fields
Field Name | Description |
|---|---|
Started | The date and time the Action started execution. |
Finished | The date and time the Action finished execution. |
Duration | The duration of time the Action took to execute. |
Message List | Displays a list of messages, showing the message type and message contents. Double-click an entry to open the Log Entry Details window which supplies a further breakdown of the message line. |
Log Entry Details
The fields and information displayed on the Log Entry Details screen will vary, depending on the Log entry line selected.
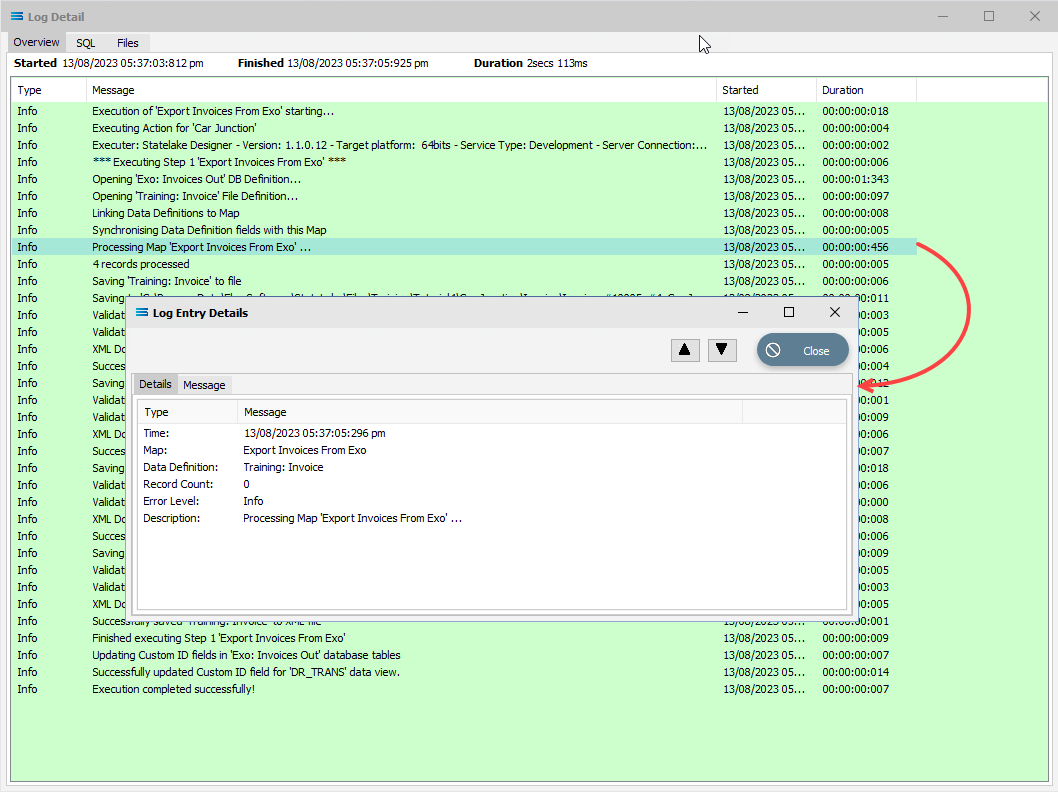
To Close this window and return to the Log Detail screen, click on the Close button.
SQL Tab
The window will display a list of the SQL statements that were executed during the running of the Action.

You can highlight the lines of text and press Ctrl-C to copy them to a text file if required.
Files Tab
The window will display a list of files read from or written to during the execution of the Action.
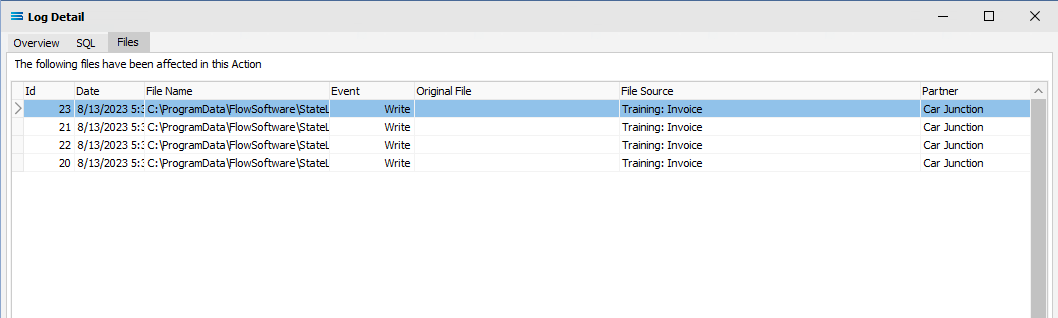
You will also see entries for the movement of files between the default folder and the Audit and Error folders.
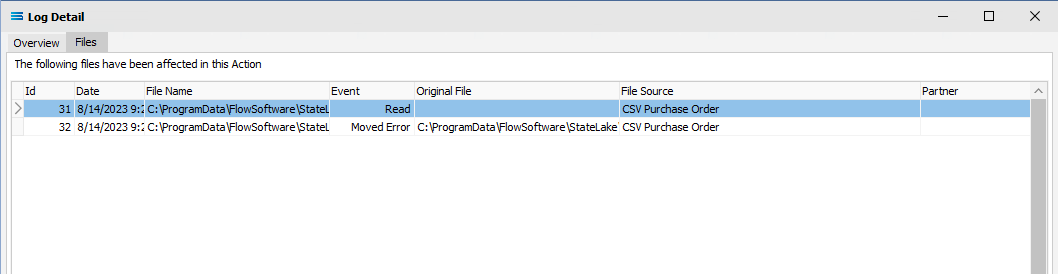
Double-click an entry to open the folder in Windows Explorer.